
How much of the economy is exposed to AI? Depends who you ask. Eloundou et al. say 80% of workers have at least some exposed tasks. Felten, Raj, and Seamans get a broadly similar but differently ranked list. When Gimbel et al. systematically compare seven leading metrics, they find the metrics agree that something is happening but disagree about where. And the disagreement is worst precisely among the occupations everyone cares about most.
We argue this isn’t primarily a measurement problem. It’s a dimensional one.
The CDR Framework
Existing frameworks compress at least three independent questions into a single exposure score. We built a taxonomy (CDR) designed to keep them separate.
C-axis: Cognitive complexity. Can AI reason about the task? Five levels from C0 (self-evident: “is a manual even necessary?”) through C4 (discovery: “is the output itself a new manual others will follow?”). Filing a form is C1 (procedural). Drafting a legal brief is C3 (expert synthesis). This extends Autor’s binary routine/non-routine distinction into a gradient with economically meaningful boundaries. AI cognitive capability is advancing through these levels fast: autonomous task horizons are doubling roughly every three months.
D-axis: Deployment difficulty. Can AI physically do the task? Five levels from D0 (purely digital: a keyboard is all you need) through D4 (dynamic multi-modal: simultaneous real-time coordination of perception, locomotion, and manipulation under time pressure). Drafting an email is D0. Harvesting strawberries (perceiving variable fruit, applying precise force to a deformable object, navigating unpredictable terrain) is D3. Physical deployment infrastructure moves on a 3–5 year cycle for structured environments, longer for unstructured ones.
R-axis: Regulatory restrictions. Do institutions allow it? Five levels from R0 (no barrier) through R4 (moral agency required: the task definitionally requires a human person, like sworn testimony or giving informed consent). A nurse can use AI to check drug interactions (R0). A nurse cannot use AI to administer controlled substances. That’s statutorily restricted (R3). The technology doesn’t matter; the barrier is institutional. Regulatory barriers move on institutional timescales: years to decades.
These three dimensions change at structurally different rates. Any framework that collapses them into a single number will systematically mispredict both the location and the timing of economic impact.
We classified every task in the U.S. economy along all three axes: 23,850 task-activity pairs across 923 occupations in O*NET, classified by three language models (Claude Sonnet 4.6, GPT-5-mini, Gemini 3 Flash) using a multi-model consensus protocol, validated against flagship models. The full classification pipeline costs under $100 per run, making CDR a reusable longitudinal instrument rather than a one-time snapshot.
The Headline Finding
50.5% of U.S. economy-weighted labor time falls in tasks that are:
- Cognitively within current AI reach (C ≤ 2: up to and including contextual judgment)
- Deployable with existing infrastructure (D ≤ 1: digital tools plus commodity sensors like smartphones, wearables, and cameras)
- Facing no professional or statutory regulatory barrier (R < 2)
Half the economy. Not in five years. Now.
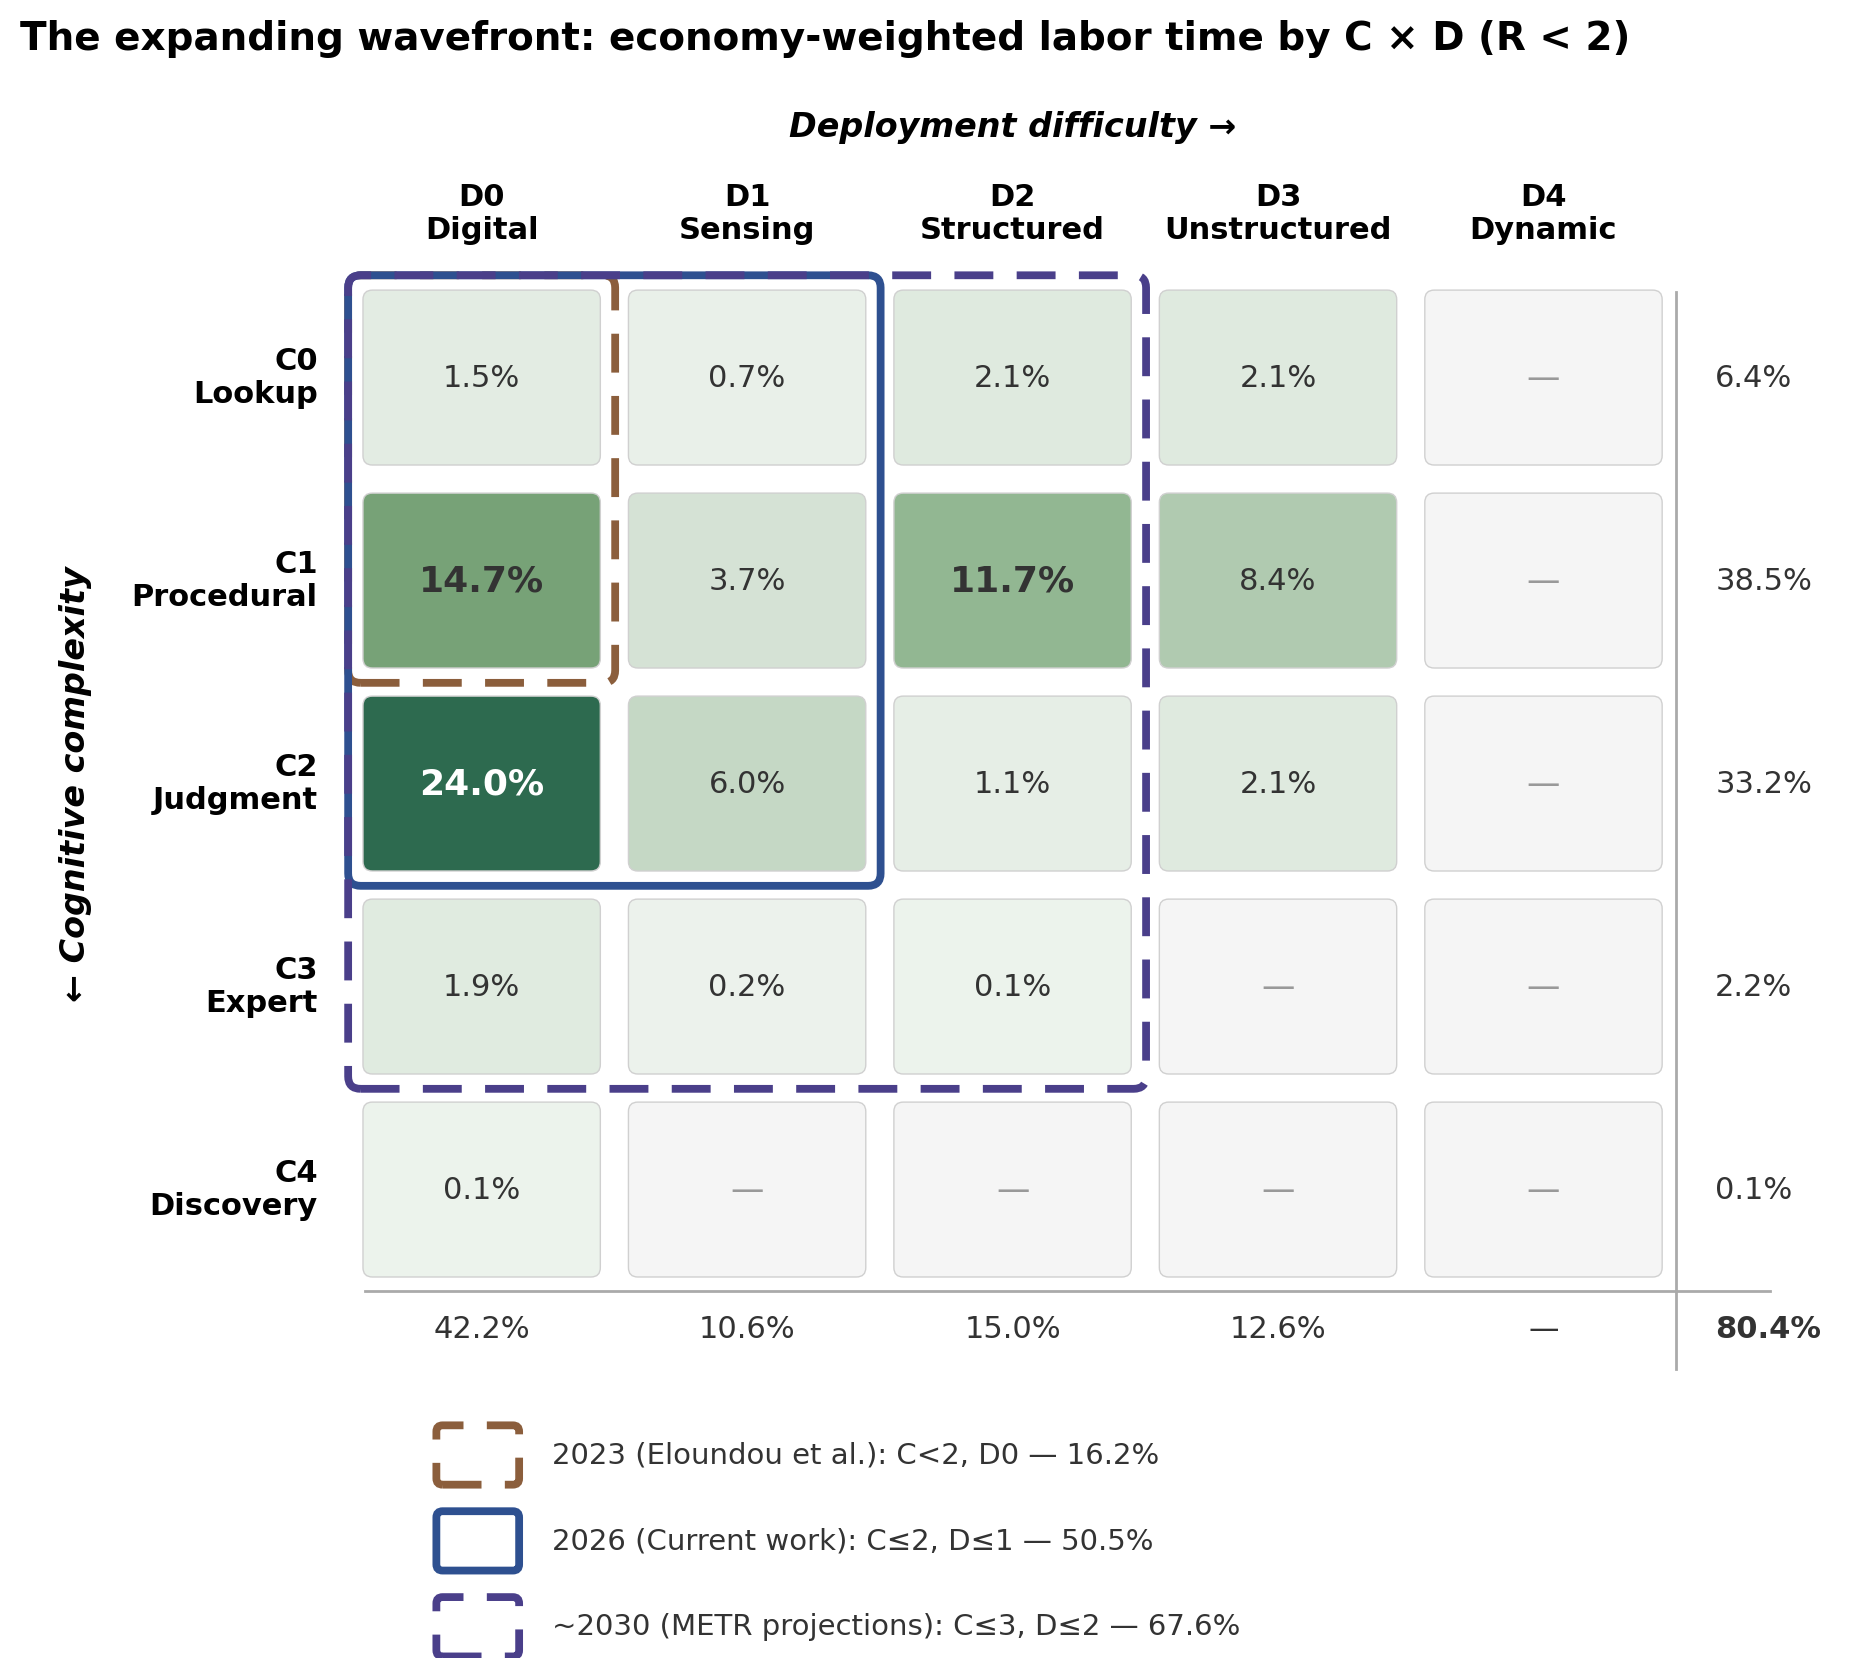
The single largest cell in the entire framework is C2/D0: tasks requiring contextual judgment but no physical interaction. That cell alone accounts for 24% of all economy-weighted labor time. These aren’t routine tasks. They require weighing tradeoffs, adapting to context, choosing among reasonable alternatives. Two workers might produce different but equally valid outputs. This is the heart of knowledge work. And it’s already within AI’s cognitive reach.
The Wavefront
The CDR framework enables a wavefront analysis: as each axis threshold is crossed, what fraction of the economy becomes accessible?
| Wavefront | Economy share | Timeline |
|---|---|---|
| C ≤ 1, D = 0 | 16.2% | 2023 (Eloundou et al. boundary) |
| C ≤ 2, D = 0 | 40.2% | 2025 (digital-only) |
| C ≤ 2, D ≤ 1 | 50.5% | Now |
| C ≤ 2, D ≤ 2 | 65.3% | ~3–5 years |
The 40.2% figure captures purely digital tasks: no physical component at all. But D1 capabilities (sensing, monitoring, navigation) already exist on commodity hardware: smartphone cameras, wearable sensors, consumer drones. Including these pushes the current frontier to 50.5%.
The step to 65% requires structured manipulation in engineered environments, which is arriving faster than commonly assumed: Agility Robotics reports 98% task success in warehouse settings, and humanoid robot deployment grew to approximately 16,000 units globally in 2025.
Regulation Is Thinner Than You Think
One finding that surprised us: regulatory restrictions block a smaller fraction of the economy than the policy discourse implies.
80.4% of labor time faces no regulatory barrier (R0–R1) or only consumer preference norms that erode under price pressure. Professional standards (R2) cover 11.5%. Statutory regulation (R3) covers 8.0%. Moral agency requirements (R4) cover 0.1%.
Within licensed occupations, we find what we call the thin chokepoint thesis: most tasks in a licensed occupation don’t actually require the license. A nurse monitors vital signs (R0), documents patient information (R0), checks drug interactions (R0), and administers controlled substances (R3). The chokepoint tasks (the ones where regulation actually binds) are few, but they ensure the profession persists. The regulatory barrier prevents full automation but does not prevent labor-saving productivity gains.
This matters for policy. Proposals to reduce occupational licensure barriers as a way to unlock AI automation are targeting the wrong constraint. The binding constraints for the vast majority of the economy are cognitive complexity and physical deployment difficulty, not regulation.
Three Speeds and the Productivity J-Curve
The standard explanation for why task-level AI capabilities haven’t yet shown up in aggregate productivity statistics is the “productivity J-curve”: general-purpose technologies suppress measured productivity during an initial investment period before eventually producing an overshoot. The historical analogy is electrification, where factory reorganization took decades.
The CDR data suggests this framing is too coarse. The nature of complementary investment varies systematically with the D-axis:
-
D0 tasks (48.9% of labor time): The required complements are cognitive: workflow redesign, prompt engineering, organizational learning. These operate on timescales of weeks to months. Early evidence (Dillon et al. 2025) shows knowledge workers capturing time savings within weeks.
-
D2–D3 tasks (35.7% of labor time): The required complements are physical: industrial robotics, sensor infrastructure, supply chain reconfiguration. These operate on timescales of years.
The D-axis provides structural grounds for predicting a shorter J-curve for the half of the economy that’s purely digital, and a longer one for the third that requires physical deployment. The aggregate productivity statistics should resolve unevenly: knowledge-work-intensive sectors first, physical sectors later.
What This Doesn’t Tell You
CDR classifies tasks within the economy as currently organized. It doesn’t model the reorganizations that follow: firms restructuring, occupations decomposing and recombining, new task categories emerging. Those dynamics require a different analytical apparatus and are the subject of planned companion work.
The framework also doesn’t tell you about the quality of AI task performance. A task classified as cognitively accessible (C ≤ 2) means AI can plausibly save time on it, not that AI output is flawless. The gap between “can help” and “can be trusted unsupervised” is where verification infrastructure becomes critical. And the sectors with mature verification (like software development, with its test suites) are adopting fastest.
Why We Built This
The policy window for AI’s labor market effects is closing faster than the policy conversation is moving. We need frameworks that can tell us not just “how much?” but “where first?” and “how fast?”. We need them to distinguish between the dimensions that are actually driving the pace of change.
CDR is designed to be rerun as capabilities advance. The prompts are version-controlled, the pipeline is reproducible, and the cost is low enough for quarterly updates. The replication package is available now; the full paper has the complete methodology and results.
The 50% number will grow. The question is how fast, and through which dimensions. That’s what CDR is built to track.
Daniel Parshall, Ph.D., is a former physicist and data scientist working on AI policy. He can be reached at dan@canaryinstitute.ai